
The Best Social Media Metrics To Focus On In Your Campaigns
Any social media plan that is worth its salt must be adequately measured. However, you might be astonished by how many marketers fail to consider looking beyond the information on the ‘Overview’ tab. Everyone agrees that keeping track of those statistics is important, which is why they are right up front, but digging deeper can yield more insightful information.
To increase brand exposure and raise social media ROI, let’s take a look at the top platforms and determine the best social media metrics you should monitor for each one.

Facebook Metrics – The Basics
Despite competition from YouTube in second position and newcomer TikTok, Facebook (owned by parent firm Meta) continues to be the most widely used social media platform. Facebook offers a variety of highly targeted and widely accessible advertising solutions for businesses. So, how can you develop and engage with Facebook analytics?
1. Facebook – Engagement
The amount of times people interact with your content is how engagement is calculated. Clicks, shares, comments, and reactions are examples of actions. This is a useful indicator for determining how well your audience responds to your material. Your content strategy will be influenced by what kinds of posts users interact with. Improved engagement also increases the number of people who see your content in their followers’ newsfeeds.

2. Facebook – Reach
Reach tells you how many people have seen your post. It is now more challenging to have messages seen organically on Facebook due to algorithm changes. Therefore, even if a company has many Facebook followers, this does not guarantee that many of them will see its posts.
The ‘Overview’ tab of your Facebook Insights page lets you see topline reach data, and the ‘Reach’ tab provides more specifics. This indicator helps illustrate the total number of unique viewers of your campaign or content.
3. Facebook – Impressions
Reach is the total number of individuals that saw your content, whereas impressions are the total number of times it was seen. An increase of one in reach and an increase of three in impressions would result from a person who saw a single post on three distinct occasions.
Go to the “Posts” tab and select “Impressions: Organic/Paid” from the drop-down menu to get impressions data. You may determine how frequently your advertisement was displayed using this data.
Your frequency metric, which represents the typical number of times a person saw your advertisement, may be obtained by dividing your impressions by your reach. When attempting to estimate brand uplift or ad recall, this can be useful.
4. Facebook – Page Likes and Followers
Likes and followers on Facebook are crucial audience metrics. People who “like” your page have declared themselves to be fans, whereas “followers” have expressed an interest in seeing postings from your pages in their newsfeeds (although the algorithm does not guarantee that they will).
To ensure that you are not losing more admirers than you are acquiring, it is crucial to monitor your audience size.
Twitter Metrics – The Basics
Twitter continues to undergo adjustments, but it remains a platform with a lot to offer marketers and businesses. Because hashtags are real-time, they can trend quickly, and businesses can use tweets to increase brand awareness and encourage participation. Let’s examine the metrics that Twitter analytics should be looking at.
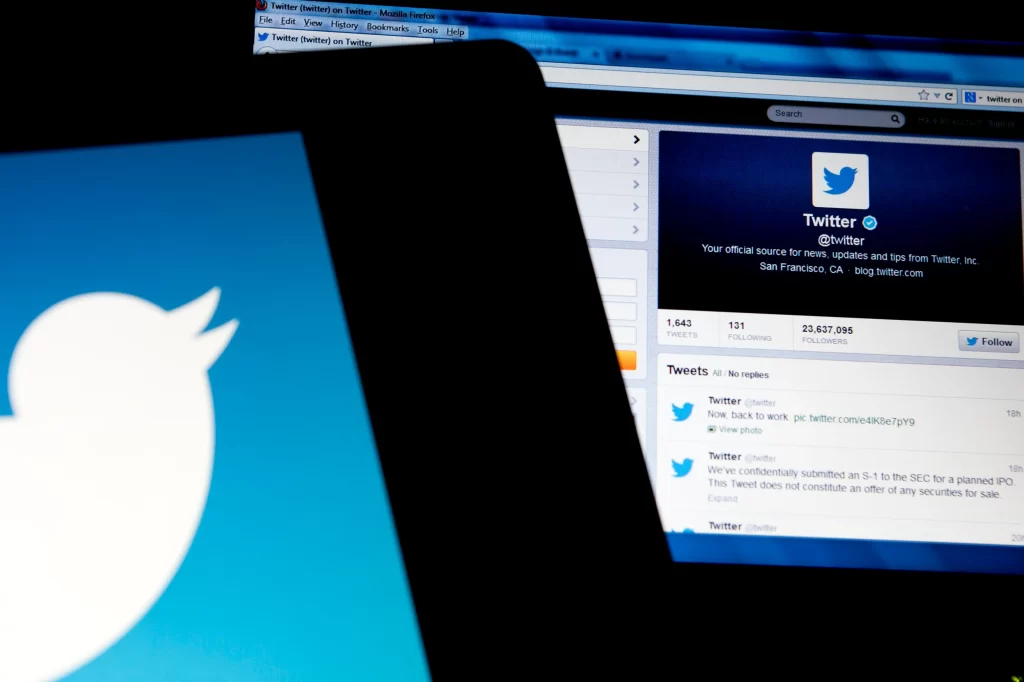
1. Twitter – Tweet Impressions
The number of times a tweet appeared as a consequence of a like, a search, or a display on your followers’ timelines constitutes this indicator. This information can be discovered in your Twitter analytics by choosing “View tweet activity” and can reveal how your content or campaign has been distributed to audiences outside of your follower list.
2. Twitter – Engagements
Any user action on Twitter, such as clicking a link, retweeting, commenting, and liking, is referred to as engagement. This metric shows whether or not your tweet inspired someone to learn more or spread the word. Under the ‘Tweet’ tab, engagement statistics can be found. More engagements are a sign that users are interested in or enjoy your content.
3. Twitter – Top Tweet
The most popular tweet for the current month can be found on the account homepage in Twitter analytics. The tweet with the most impressions includes both the top media tweet (which contains a photo or video) and the top card tweet (which includes a card). Whether it be the kind of content, the hashtag used, the day and time of the tweet, or a combination of some or all of those elements, it’s a crucial indicator of what resonates with your audience.
4. Twitter – New Followers
The number of new users who decided to follow your Twitter account in the last month is represented by the term “new followers.” More than retweets or likes, choosing to follow your brand demonstrates a stronger relationship with it. This is a valuable key performance indicator (KPI) for how well your brand is doing overall at expanding its audience.
5. Twitter – Top Follower
The top follower is the one who has been following you for the longest and has the most followers of their own. The most likely people to share your tweets with others by liking or retweeting them are your top followers.
6. Twitter – Top mention
The tweet in which your @handle was mentioned the most times was this one. The individuals that are behind your most popular tweets are frequently excellent candidates for potential influencer marketing campaigns because they have a sizable following and are interested in your company.
Instagram Metrics – The Basics
According to the Business of Apps, Instagram is the fourth most popular social media app in the world with over two billion monthly users. Instagram can be a useful tool for businesses trying to increase brand exposure and engagement, especially among people over 35, thanks to a recent concentration on video formats. Let’s look at the most important parameters to monitor when utilizing Instagram analytics.
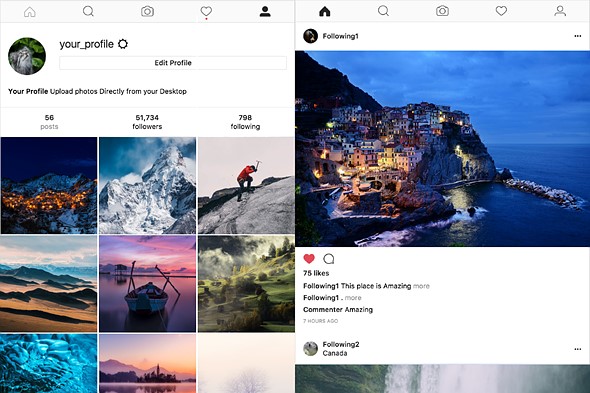
1. Instagram – Impressions
This represents how many times your audience has seen your content. The data is further broken down by Instagram analytics, which displays impressions that originated from home, from profiles, or hashtags. Utilizing hashtags wisely will increase the impressions of your posts.
2. Instagram – Reach
Reaching is a crucial indicator to evaluate the success of an Instagram campaign or post. This is the total number of distinct individuals or accounts that have seen your post.
3. Instagram – Content interactions
This analyzes user interactions with your content, such as likes, comments, shares, saves, and replies. This represents all user actions that have been made directly on your post.
4. Instagram – Explore
Users can discover fresh, pertinent content from accounts they might not already be following using Instagram’s Explore feature. It consists of images, videos (for more information, read our guide to IG video formats), reels, and stories, all of which are curated by Instagram’s algorithm based on comparable accounts or content that has been interacted with. The number of users who were contacted through the feature but are not currently following you will be displayed in Instagram’s insights.
5. Instagram – Accounts reached and accounts engaged
Engagement with your feed and postings is shown by these measures. The number of distinct accounts that have viewed your material at least once is known as the number of accounts reached, which also includes social media demographics like the top nations, top cities, top age groups, and top genders.
Accounts engaged gives a breakdown (like the one above) of all the distinct accounts that have interacted with your material.
Pinterest Metrics – The Basics
For businesses that publish excellent photos or other visual content, Pinterest is the place to be. Because women make up the majority of users, it is perfect for businesses looking to cater to women and is especially beneficial for brands in the fashion, cosmetics, home décor, DIY, and food industries. Let’s examine the main metrics that Pinterest analytics should concentrate on.
1. Pinterest – Pins
People save their favorite websites using pins. These could be things, pictures, or videos. Because pins can be found and clicked, marketers can utilize them to direct visitors to a website or landing page to increase engagement and conversion rates. You may learn about pin clicks and click rates by keeping track of the number of pins, which reveals the typical amount of content from your website that is pinned every day.
2. Pinterest – Saves
The Saves function, formerly known as Repins, enables users to save or pin your content to their boards. This gives your content more visibility and reach because followers can see it in their feeds. Monitoring the daily average of saves is a useful indicator of how well your material is doing.
3. Pinterest – Impressions & Engagement
Impressions and engagement are crucial metrics to monitor on Pinterest, just like they are on other social media platforms. These display how well your visual material is performing on the platform. A high Pin impression rate indicates that your article is relevant. The Engagement measure displays all interactions with your Pins, including saves, clicks, swipes on carousel cards, clicks on collections, and forward/backward swipes on Idea Pins.
4. Pinterest – Top converting pins
This measure is helpful to monitor since it reveals which material is working well and enables you to delve deeper to see why. Does it offer a solution to a problem, is it a video, or is it associated with an influencer?
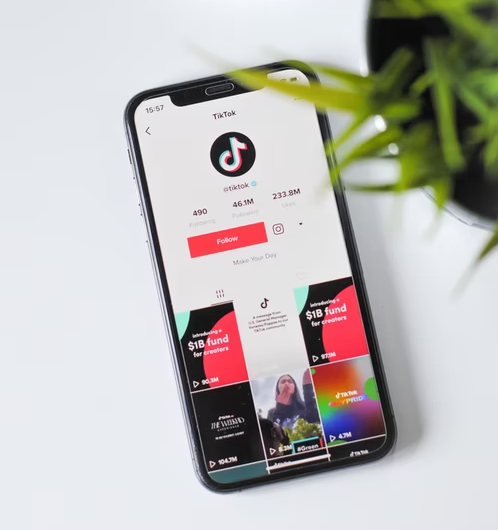
TikTok Metrics – The Basics
According to the Business of Apps, TikTok, the newest platform in town, has amassed over 1 billion users in just five years and generated $4.6 billion in income in 2021 alone. Its easy-to-use platform and entertainment value are to blame for this popularity.
Additionally, it is a platform that enables people and brands to become viral sensations, collecting fans and increasing brand recognition in the process. Let’s take a look at the metrics you should monitor on TikTok as its usability for businesses is predicted to alter in 2023 (make sure you have a Business account to view analytics).
TikTok has four tabs for its analytics:
1. TikTok – Overview
You may view other metrics, such as Engagement, Followers, and Content, under the “Overview” tab. It’s a fantastic technique to gain an understanding of the crucial TikTok account stats.
Here, you may view video views and profile views, which, if brand awareness is a KPI for your company, reveal how many people have viewed your profile. Data on shares, likes, comments, and followers are also displayed.
2. TikTok – Content
The performance of your video material is the focus of the material tab. Along with likes, comments, and shares on a video, it offers information on total video views, trending videos, and other statistics.
It can go further by providing information such as the total play time, average watch time, audience reached, and the number of people who watched the entire video. You can determine what kind of video content is engaging your audience using this data.
3. TikTok – Followers
You can learn more about your followers on this tab. It provides information on follower activity, location, and gender as well as when your followers are active. There are additional videos and audio files that your followers watch and listen to.
4. TikTok – LIVE
A significant component of TikTok is live video, which is a fantastic method to increase interaction and gain prizes like Diamonds. The stats are displayed on the tab, along with viewer count and unique viewers, as well as total views and time.
5. TikTok – Hashtag performance
On TikTok, hashtags are very popular, so keeping an eye on performance can be useful. The amount of times a hashtag has been viewed is indicated by its hashtag views. To find out what’s hot or popular, you may also search for a hashtag in the ‘Discover’ section.
LinkedIn Metrics – The Basics
The social media platform LinkedIn, which will be 20 next year, has grown to have more than 875 million users globally. It is regarded as the top B2B platform and a place where people may progress in their professions. Let’s learn how to monitor the success of your B2B campaigns using LinkedIn analytics.
1. LinkedIn – Visitors
Using visitor analytics, you can observe who is visiting your page and identify dips and peaks in traffic to determine what kind of content is most popular. To go deeper into your visitor profile, such as job function, seniority, firm size, and industry, use the filters below (page views, dates, unique visitors).
2. LinkedIn – Followers
You may see the origins and demographics of people who follow your company page using LinkedIn’s Follower tool. You can use this metric to find out who is following you and how to interact with them most effectively.
3. LinkedIn – Impressions & Engagement
Impressions represent the number of times a user has seen your content. This measure is crucial because it lets you know how frequently your material is viewed and raises the likelihood that someone will interact with it. Track unique impressions as well because it indicates how many distinct LinkedIn users saw your content.
The number of interactions, clicks, and new followers added on LinkedIn are added together and divided by the total number of post impressions to determine the engagement rate. You will have a more complete understanding of how the material is performing if you include this in your study.
4. LinkedIn – Competitor
The ‘Analytics’ page has a tool called “Compare Follower Metrics and Organic Content Metrics” that is presently only available to some users. You’ll learn more about the types of content that succeed for your competition and receive insight into their audience.
Next Level Social Media Metrics
You may develop digital marketing KPIs to assist in measuring how effectively your social media plan is doing from the perspectives of awareness, engagement, and consumer happiness with a little additional investigation and calculation. Here are five advanced indicators for social media marketing that you should think about monitoring.
Follower Growth Rate
It makes sense that brands can anticipate a comparable rate of increase in their social media audience as internet availability expands globally. Therefore, measuring the rate at which your brand is collecting followers is crucial, as is evaluating your growth rate in comparison to that of your rivals.
As a result, the question “How much is our audience growing?” has been replaced by “How fast is our audience growing?” You might need to take action to buck the trend if you notice a flattening of your social media audience growth rate.
Add up your net follower growth across all platforms for the preceding month, divide that number by your overall audience across all platforms, and then multiply the result by 100 (to get the audience growth rate as a percentage).
You might consider performing the same calculation on the social media channels used by your rivals for comparative purposes.
Social Share of Voice
Social Share of Voice (SSoV) contrasts brand mentions on social media with those of all of your rivals. It’s a practical technique to determine how noticeable, pertinent, and “top of mind” your brand is in the marketplace.
Start by tracking any mentions of your brand during the month on social media, whether they were made with your handle or your name. (This procedure can be made simpler by using social media analytics and monitoring technologies.) The same should be done for your rivals. To calculate your share of voice percentage, divide your total mentions by the total mentions of all brands (including your own) and multiply the result by 100.
Amplification Rate
Amplification rate measures the frequency with which followers share your material by dividing the number of shares for each post by the total number of followers. It’s a KPI that shows how willing your audience is to connect with and engage with your business.
Your followers’ ability to reach more people for you increases with your amplification rate. By dividing the number of shares a post received by the sum of your followers, you can determine the amplification rate and convert it to a percentage by multiplying the result by 100.
Virality Rate
There are plenty more factors to consider when evaluating a post’s quality than just how many people liked it or shared it. By measuring the share percentage relative to the total number of times a post was displayed, one can determine how likely it is to go viral. The formula is straightforward: 100 is multiplied by the total shares, which are split by the total impressions. The virality rate is as follows.
Let’s say a post received 400 likes, but only 2,000 of the 20,000 viewers shared it. This post has greater potential than one that had 1,000 likes but only 2,000 of the 200,000 viewers shared it.
Social sentiment
Sentiment measures emotions and attitudes, whereas social sharing measures your participation in online conversations. Are there any positive or bad comments made about your brand when people discuss it online?
You May Also Like

Web Development
Web development refers as a whole to the tasks linked with developing websites for hosting via the internet. The web development process includes web design, web content development, client-side/server-side scripting, and network security configuration, among other tasks. In a broader sense, web development bound...

What Makes Quality Backlinks?
High domain authority (DA) websites that are respectable and well-trusted by both users and search engines are the sources of quality backlinks or inbound links. This makes the target website appear to users and bots as a reliable source of information. A good backlink...

Social Media Marketing (SMM)
Social media marketing (SMM) is the use of social media the platforms on which users build social networks and share information, increase sales, and drive website traffic. In addition to providing companies with a way to engage with existing customers and reach new ones...

Tips to Content SEO
The technique of optimizing your website’s content for Search Engine Results Pages is known as content SEO (Search Engine Optimization) (SERPs). Businesses may get the knowledge and direction they need from Analytica Digitals to create and implement an effective content SEO strategy that increases exposure...